olivia


By Iris Smith, Ph.D.
Suicide is one of the leading causes of death in the U.S. In 2022, over 49,000 people died by suicide. Suicide rates in the U.S. increased 37% between 2000 and 2018, decreasing by 5% between 2018 and 2020 and returning to their peak in 2022.1 In 2022 the rates among males were approximately 4X higher than the rate among females. Males make up 50% of the population but nearly 80% of suicides. Among adolescents 15-24 the rate of suicide was 13.6% . Among youth 10-14 the rate was 2.4% and was the leading cause of death for this group. Ethnic and gender minority and multi-racial youth may be at higher risk compared to White youth.
In 2019, suicide was the third leading cause of death for Black youth 5-19 years old. Between 2003 and 2019 rates of suicide in this group increased by 131%, with rates for black girls two times that of boys. A study by Bridge et al. (2018) found that Black children were twice as likely to die by suicide compared to White youth and more likely to commit suicide at younger ages.2 Among American Indian/Alaskan Native youth it is the leading cause of death for 15-19 years old, and the second leading cause of death for those 10-14. Suicide is also the leading cause of death for Asian/Pacific Islander youth and the second leading cause of death for Hispanic youth between 15 and 19 years old. Although data is limited, some studies have also reported higher rates among gender minority and multi-racial youth.3,4
The root causes of youth suicide are complex and are associated with individual behaviors. mental and physical health as well as factors at the community and societal level. Bullying, discrimination, racism and other adverse childhood experiences (ACEs) have been identified as contributing factors. Among Hispanic youth, fear of deportation and xenophobia are also associated with the likelihood of depression and suicide. One study found that 25% of Hispanic adolescents who had experienced the deportation of a family member had a 2.63 greater likelihood of suicide compared to non-immigrant peers. Among young Black adults the most frequently reported reasons for considering suicide were “feeling hopeless about the future” and experiencing feelings of “ failure”, “hopelessness” and “being overwhelmed by a lack of accomplishment”. In this study, young Black women were more likely to report that they considered suicide because they felt they “were unable to live up to the expectations of others.”5
Early drug use is also associated with suicidal behavior. A recent systematic review and meta-analysis of research studies published between 1991-2020 found that youth who misused drugs were 3.32 times more likely to consider or attempt suicide compared to non-users. Fifteen of the 78 studies reviewed found an increased suicide risk for adolescents who used cannabis or cocaine.6 Studies of adult patients diagnosed with substance use disorders (SUDs) have also found a strong association between alcohol and other substance use, previous history of sexual abuse, depression and suicidal behaviors.7 Findings from these studies highlight the importance of cross training mental health and substance use treatment providers in the use of screening tools for depression, suicide risk and substance use.
Preventing suicide requires a multi-pronged approach that addresses the known risk factors at the individual, family and community level. For example, training primary care providers to recognize the signs of depression and suicide risk in adolescent patients, conduct active outreach and follow-up of individuals who have recently experienced or been treated for depression or a suicide crisis. There are several validated screening tools for both suicide risk and depression however, few have been evaluated for effectiveness with ethnic and gender minority youth, immigrants or multi-racial youth. There is also a need for additional research on evidence-based targeted interventions for these groups. Universal prevention strategies can also be effective in raising community awareness of the signs of depression and risks factors associated with self-harm and action steps to take including, restricting access to lethal means such as firearms, which has become one of the frequently used means among youth in the U.S.
Resources
National Institute on Minority Health and Health Disparities HD Pulse An Online Resource for Interventions to Reduce Health Disparities and Improve Minority Health.
Intersection of Addiction and Racism: A Curated Bibliography : A collection of resources related to racism, anti-racism and advancing health equity for Black, Indigenous and other marginalized communities affected by unhealthy substance use. Centers for Disease Control and Prevention (CDC): Suicide Prevention Tools for Public Health Professionals.
2 Bridge et al. (2018). Age-Related Racial Disparity in Suicide Rates Among U.S. Youths From 2001-2015. JAMA Pediatrics: 172 (7); pg. 607-609.
3 Benton T. D. (2022). Suicide and Suicidal Behaviors Among Minoritized Youth. Child and adolescent psychiatric clinics of North America, 31(2), 211–221. https://doi.org/10.1016/j.chc.2022.01.002
4 Marconi, E., Monti, L., Marfoli, A., Kotzalidis, G. D., Janiri, D., Cianfriglia, C., Moriconi, F., Costa, S., Veredice, C., Sani, G., & Chieffo, D. P. R. (2023). A Systematic Review on Gender Dysphoria in Adolescents and Young Adults: Focus on Suicidal and Self-Harming Ideation and Behaviors. Child and Adolescent Psychiatry and Mental Health, 17(1), 110. https://doi.org/10.1186/s13034-023-00654-3
5 Goodwill J. R. (2024). Reasons for Suicide in Black Young Adults: A Latent Class Analysis. Journal of racial and ethnic health disparities, 11(1), 425–440. https://doi.org/10.1007/s40615-023-01530-8
6 Oliveira Gracini, C. L., Nascimento, G. G., Vidigal, M. T. C., Oliveira, M. N., Herval, Á. M., Blumenberg, C., Vieira, W. A., Lima, R. R., & Paranhos, L. R. (2024). Suicide ideation and psychotropic recreational drug use by adolescents: a systematic review and meta-analysis. Sao Paulo medical journal = Revista paulista de medicina, 142(4), e2022641. https://doi.org/10.1590/1516-3180.2022.0641.R2.23012024
7 Armoon, B., SoleimanvandiAzar, N., Fleury, M. J., Noroozi, A., Bayat, A. H., Mohammadi, R., Ahounbar, E., & Fattah Moghaddam, L. (2021). Prevalence, Sociodemographic Variables, Mental Health Condition, and Type of Drug Use Associated with Suicide Behaviors Among People with Substance Use Disorders: a Systematic Review and Meta-Analysis. Journal of addictive diseases, 39(4), 550–569. https://doi.org/10.1080/10550887.2021.1912572
Twenty-five years ago, Surgeon General Dr. David Satcher issued a ground-breaking Call to Action to Prevent Suicide, leading to the first National Strategy for Suicide Prevention in 2001. Since then, significant advancements have been made in data timeliness, suicide prevention science, new treatments, and research. Despite these efforts, rising suicide rates indicate that more work is needed.
2024 National Strategy Overview The 2024 National Strategy for Suicide Prevention aims to address existing gaps and promote a coordinated, comprehensive approach to suicide prevention across the United States. This strategy focuses on multiple factors associated with suicide, recognizing that there is no single solution. It emphasizes:
Collaboration and Infrastructure The strategy relies on collaboration with public and private sector partners, individuals with lived experience, and populations disproportionately affected by suicide. Key components include:
Whole of Government Approach For the first time, the 2024 strategy adopts a "whole of government" approach, developed in collaboration with a federal Interagency Work Group comprising over 20 agencies and offices across 10 departments. Support came from the Suicide Prevention Resource Center (SPRC) and the National Action Alliance for Suicide Prevention (Action Alliance), with guidance from SAMHSA, CDC, NIMH, and ASPE/HHS. Input was gathered from over 2,000 respondents through a national needs assessment and multiple listening sessions.
New Focus Areas Building on the 2012 strategy, the 2024 strategy addresses health equity, youth and social media, and the intersection of suicide and substance use. New content includes:
Strategic Directions and Goals The strategy is organized into four Strategic Directions:
These directions guide the goals and actions necessary to reduce suicide rates and support those affected by suicide.
These highlights contain some of the key points of the 2024 National Strategy for Suicide Prevention which represents a comprehensive and collaborative effort to address the complex issue of suicide, aiming to save lives and promote mental health across the nation. We invite you to download the document to learn more https://www.hhs.gov/sites/default/files/national-strategy-suicide-prevention.pdf
By Darla Kelsay, Certified Prevention Consultant, Substance Abuse Prevention Coordinator, MidSOUTH Center for Prevention and Training
A new documentary chronicling the fentanyl crisis in North Texas will help raise community awareness about the potent synthetic opioid and shatter the myth that overdose is not happening in the Lone Star State. Scheduled for release this month, Dancing with Death is the collaborative brainchild of three regional organizations dedicated to reducing overdose deaths and saving the lives of North Texans.
“We know it’s happening here,” stated Becky Tinney, Director of Special Projects for the Recovery Resource Council, the most comprehensive nonprofit behavioral health care provider in North Texas with campuses in Fort Worth, Dallas, and Denton. She along with Specialist Joshua Reyes of the Texoma High Intensity Drug Trafficking Area (HIDTA) had been dealing firsthand with families who tragically lost a loved one to fentanyl overdose. The two agencies serve multiple shared counties. “When someone dies from fentanyl, they (families) want to know what happened, what you’re going to do about it, and how to prevent it.”
School administrators were also reaching out to Tinney and Reyes after students had overdosed and died. The schools desperately needed experts in the field to address youth about the dangers of fentanyl and explain that the powerful opioid drug, approved by the FDA to treat patients in severe pain, is found in unregulated counterfeit pills and illicit drugs, making it even more perilous.
“The uptick of fentanyl poisonings and death has brought about a lot of conversations about prevention education to the forefront,” said Tinney, a certified prevention specialist and licensed chemical dependency counselor. “The epidemic has broken down a lot of barriers that prevention education as a field has traditionally come up against in engaging with communities and schools because it is impacting everybody.”
Texas Health and Human Services reported in 2023 that, on average, five Texans die every day from fentanyl poisoning1. The state’s drug overdose deaths have increased by more than 75% in the past five years with a 2.1% increase reported by the Centers for Disease Control between February 2023 and February 20242. Several counties served by the Northern Texas collaborative organizations have some of the highest synthetic opioid mortality rates in Texas.
Even so, community readiness to address the issue in the region was low due to denial that fentanyl overdose was a local problem. It did not help that the documentary Tinney and Reyes were sharing during their educational talks on fentanyl featured folks from another state. “They were just not representative of North Texas communities. They did not look like us or sound like us,” said Tinney.
After realizing that communities viewing the documentary could not relate to the people sharing their stories or connect them to their neighborhoods, Tinney and Reyes got the idea to create their own documentary using the faces of the Texans they knew who were impacted by devastating loss. “We felt like we had all the pieces necessary to create something that was more representative of our communities,” she said. “It’s Important for the audience to be able to see themselves in the documentary.” The final project came to fruition over a series of months thanks to the collaborative efforts of the Recovery Resource Center, Texoma HIDTA, and the Dallas Area Drug Prevention Coalition - a longstanding DFC coalition that assisted in securing families to share their stories and some funding to produce the documentary.
Tinney says that the families involved in the filming wanted their loved ones remembered for something greater than using illicit drugs and overdose. Sharing their heartfelt stories was a way to highlight that fentanyl overdose can happen to anyone – even those youth who are on the honor roll or who have never been in trouble. “The overall prevention message is that awareness is so important,” explains Tinney, who encourages parents to have hard conversations with their children about fentanyl and other drugs. “We cannot wait for something to happen. With fentanyl, it really can be one time.”
A certified prevention specialist, Becky Tinney recently launched the agency’s Overdose Response Team program in both Dallas and Tarrant Counties and the Overdose Fatality Review Committee for Tarrant County – the first in the state of Texas. Becky oversees the Council’s position as the public health partner for the Center for Disease Control’s Overdose Response Strategy program for the North Texas region, a partnership program with the High Intensity Drug Trafficking Area program. She is also a contributing member on several opioid-focused task forces and work groups across the metroplex, including the City of Dallas’s Opioid and Fentanyl Strike Force, Tarrant County Public Health’s Overdose Workgroup, UNT Police Department’s Fentanyl/ Overdose Awareness Coalition, and Dallas ISD’s Substance Abuse Task Force. Becky is passionate about serving others, making community-level impact, and creating and leading programs that are aimed at reducing harm and making meaningful change.
The Texoma High Intensity Drug Trafficking Area (HIDTA) is a federal program that aims to reduce drug trafficking and misuse by coordinating law enforcement, treatment, and prevention initiatives.
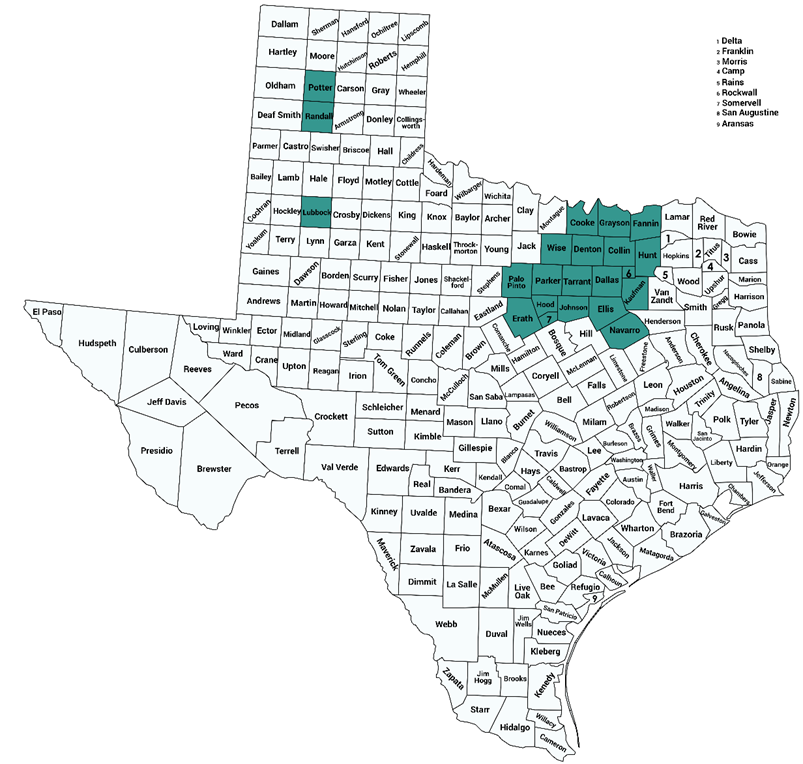
The Texoma High Intensity Drug Trafficking Area (HIDTA) region encompasses seventeen counties in North Texas and eight counties in Oklahoma. The region includes two major drug market areas, the Dallas/Fort Worth metropolitan area and Oklahoma City metropolitan area. It also includes three primary satellite areas: Amarillo and Tyler, Texas and Tulsa, Oklahoma. These markets constitute the most significant areas of illicit drug trafficking and abuse within the HIDTA region.
[1] Governor Abbot Unveils Texas Fentanyl Data Dashboard, July 13, 2023, https://gov.texas.gov/news/post/governor-abbott-unveils-texas-fentanyl-data-dashboard
[2] Ahmad FB, Cisewski JA, Rossen LM, Sutton P. Provisional drug overdose death counts. National Center for Health Statistics. 2024.


By Iris Smith, Ph.D.
Opioids are becoming the most common cause of fatal poisonings in young children. Between 2019 and 2021 drug overdose deaths in children ages 10-19 rose by 109%, with opioids being implicated most often. Overdoses in infants and children under 5, have also increased.
In younger children (1–4-year-olds), overdose is usually the result of accidental poisoning, occurring as a result of exposure to adult drugs or drug paraphernalia such as analgesic patches, pills, or environmental contamination in locations where drugs are used by adults. Among adolescents, recreational use is becoming more prevalent, with the availability of opioid-laced edibles, pills, and vaping products possibly contributing to increased rates in this group. However, the extent of adolescent use of these products remains unclear.1
Overdose fatalities increased from 24.1% in 2005 to 52.2% in 2018. One-third of these cases were in children under 1 year of age and many of the victims had a history of abuse or neglect.1 Opioid drug use among high school athletes is associated with increased risk of opioid use for injury-related pain. An average of 28% to 46% of high school athletes have used opioids in their lifetime and some studies estimate that participation in at least one high school sport increases the risk of future opioid use by 30%.2 A 2022 study that analyzed data for a single hospital visit reported to the Toxicology Investigators Consortium (ToxIC) core registry between 2017 and 2022 found that patients 15–34-years old accounted for approximately 2/3 of suspected exposures. Other substances in addition to fentanyl were identified in approximately 90% of exposures.3
Since 2020, there has been a greater relative increase in overdose mortality among adolescents compared to the overall population. In 2019, unintentional overdose was a leading cause of adolescent mortality, costing more years of life lost (YLL) than congenital disorders, heart disease, intentional overdose, and chronic lower respiratory disease. In 2020, it surpassed YLL to cancer.4
Much of the increase can be attributed to fentanyl and fentanyl analogs, such as xylazine. However, overdose deaths involving xylazine began to increase in 2019 and comprised 16% of all overdose rates by 2021. The highest rates of overdose were among American Indian and Alaska Native adolescents, similar to rates seen in adult populations from these groups. However, high rates of overdose in Latinx adolescents contrast with lower rates for adult Latinx populations.5
Counterfeit pills are becoming more available to all populations, including young people. According to the Drug Enforcement Administration (DEA) hundreds of thousands of counterfeit prescription pills have infiltrated the drug market. In 2023, the DEA seized more than 80 million lethal doses of fentanyl and so far in 2024 there have been approximately 31,500,000+ fentanyl pill seizures.6
The proliferation of opioids, including fentanyl and its analogs, has had a far-reaching effect on families across the United States. Accidental exposure to these drugs can be prevented by safe storage and disposal of adult prescription medications and drug using paraphernalia. Health providers including pediatricians, primary care providers, and emergency medical personnel should be trained to recognize the symptoms of opioid exposure and overdose in young children, especially those who reside in homes where there is known or suspected drug use.1 There is also a need to develop evidence-based interventions for adolescents. Culturally tailored interventions are needed to address disparities among rural, African American, American Indian, Alaskan Native, and Latinx youth.
Sandelich, S., Hooley, G., Hsu, G., Rose, E., Ruttan, T., Schwarz, E. S., Simon, E., Sulton, C., Wall, J., & Dietrich, A. M. (2024). Acute opioid overdose in pediatric patients. Journal of the American College of Emergency Physicians open, 5(2), e13134. https://doi.org/10.1002/emp2.13134
Benjamin HJ, Perri MM, Leemputte J, Lewallen L, DeVries C. (2024) Opioids and Youth Athletes. Sports Health. 2024;16(2):269-278. 10.1177/19417381241228629
Glidden E, Gladden RM, Dion C, et al. Suspected Counterfeit M-30 Oxycodone Pill Exposures and Acute Withdrawals Reported from a Single Hospital — Toxicology Investigators Consortium Core Registry, U.S. Census Bureau Western Region, 2017–2022. MMWR Morb Mortal Wkly Rep 2024; 73:642–647. DOI: http://dx.doi.org/10.15585/mmwr.mm7329a2.
1 Sandelich, S., Hooley, G., Hsu, G., Rose, E., Ruttan, T., Schwarz, E. S., Simon, E., Sulton, C., Wall, J., & Dietrich, A. M. (2024). Acute opioid overdose in pediatric patients. Journal of the American College of Emergency Physicians open, 5(2), e13134. https://doi.org/10.1002/emp2.13134
2 Benjamin HJ, Perri MM, Leemputte J, Lewallen L, DeVries C. (2024) Opioids and Youth Athletes. Sports Health. 2024;16(2):269-278. doi: 10.1177/19417381241228629
3 Glidden E, Gladden RM, Dion C, et al. Suspected Counterfeit M-30 Oxycodone Pill Exposures and Acute Withdrawals Reported from a Single Hospital — Toxicology Investigators Consortium Core Registry, U.S. Census Bureau Western Region, 2017–2022. MMWR Morb Mortal Wkly Rep 2024; 73:642–647. DOI: http://dx.doi.org/10.15585/mmwr.mm7329a2.
4 Hermans SP, Samiec J, Golec A, Trimble C, Teater J, Hall OT (2023). Years of Life Lost to Unintentional Drug Overdose Rapidly Rising in the Adolescent Population, 2016-2020. Journal of Adolescent Health 72; pg 397-403.
5 Friedman J, Godvin M, Shover CL, Gone JP, Hansen H, Schriger DL. Trends in Drug Overdose Deaths Among US Adolescents, January 2010 to June 2021. JAMA. 2022;327(14):1398–1400. doi: 10.1001/jama.2022.2847
6 DEA Congressional Affairs Report (2024). United States Drug Enforcement Administration. Fentanyl Seizures in 2024. https://www.dea.gov/
By Darla Kelsay, Certified Prevention Consultant, Substance Abuse Prevention Coordinator, MidSOUTH Center for Prevention and Training
A new documentary chronicling the fentanyl crisis in North Texas will help raise community awareness about the potent synthetic opioid and shatter the myth that overdose is not happening in the Lone Star State. Scheduled for release this month, Dancing with Death is the collaborative brainchild of three regional organizations dedicated to reducing overdose deaths and saving the lives of North Texans.
“We know it’s happening here,” stated Becky Tinney, Director of Special Projects for the Recovery Resource Council, the most comprehensive nonprofit behavioral health care provider in North Texas with campuses in Fort Worth, Dallas, and Denton. She along with Specialist Joshua Reyes of the Texoma High Intensity Drug Trafficking Area (HIDTA) had been dealing firsthand with families who tragically lost a loved one to fentanyl overdose. The two agencies serve multiple shared counties. “When someone dies from fentanyl, they (families) want to know what happened, what you’re going to do about it, and how to prevent it.”
School administrators were also reaching out to Tinney and Reyes after students had overdosed and died. The schools desperately needed experts in the field to address youth about the dangers of fentanyl and explain that the powerful opioid drug, approved by the FDA to treat patients in severe pain, is found in unregulated counterfeit pills and illicit drugs, making it even more perilous.
“The uptick of fentanyl poisonings and death has brought about a lot of conversations about prevention education to the forefront,” said Tinney, a certified prevention specialist and licensed chemical dependency counselor. “The epidemic has broken down a lot of barriers that prevention education as a field has traditionally come up against in engaging with communities and schools because it is impacting everybody.”
Texas Health and Human Services reported in 2023 that, on average, five Texans die every day from fentanyl poisoning1. The state’s drug overdose deaths have increased by more than 75% in the past five years with a 2.1% increase reported by the Centers for Disease Control between February 2023 and February 20242. Several counties served by the Northern Texas collaborative organizations have some of the highest synthetic opioid mortality rates in Texas.
Even so, community readiness to address the issue in the region was low due to denial that fentanyl overdose was a local problem. It did not help that the documentary Tinney and Reyes were sharing during their educational talks on fentanyl featured folks from another state. “They were just not representative of North Texas communities. They did not look like us or sound like us,” said Tinney.
After realizing that communities viewing the documentary could not relate to the people sharing their stories or connect them to their neighborhoods, Tinney and Reyes got the idea to create their own documentary using the faces of the Texans they knew who were impacted by devastating loss. “We felt like we had all the pieces necessary to create something that was more representative of our communities,” she said. “It’s Important for the audience to be able to see themselves in the documentary.” The final project came to fruition over a series of months thanks to the collaborative efforts of the Recovery Resource Center, Texoma HIDTA, and the Dallas Area Drug Prevention Coalition - a longstanding DFC coalition that assisted in securing families to share their stories and some funding to produce the documentary.
Tinney says that the families involved in the filming wanted their loved ones remembered for something greater than using illicit drugs and overdose. Sharing their heartfelt stories was a way to highlight that fentanyl overdose can happen to anyone – even those youth who are on the honor roll or who have never been in trouble. “The overall prevention message is that awareness is so important,” explains Tinney, who encourages parents to have hard conversations with their children about fentanyl and other drugs. “We cannot wait for something to happen. With fentanyl, it really can be one time.”
A certified prevention specialist, Becky Tinney recently launched the agency’s Overdose Response Team program in both Dallas and Tarrant Counties and the Overdose Fatality Review Committee for Tarrant County – the first in the state of Texas. Becky oversees the Council’s position as the public health partner for the Center for Disease Control’s Overdose Response Strategy program for the North Texas region, a partnership program with the High Intensity Drug Trafficking Area program. She is also a contributing member on several opioid-focused task forces and work groups across the metroplex, including the City of Dallas’s Opioid and Fentanyl Strike Force, Tarrant County Public Health’s Overdose Workgroup, UNT Police Department’s Fentanyl/ Overdose Awareness Coalition, and Dallas ISD’s Substance Abuse Task Force. Becky is passionate about serving others, making community-level impact, and creating and leading programs that are aimed at reducing harm and making meaningful change.
The Texoma High Intensity Drug Trafficking Area (HIDTA) is a federal program that aims to reduce drug trafficking and misuse by coordinating law enforcement, treatment, and prevention initiatives.
The Texoma High Intensity Drug Trafficking Area (HIDTA) region encompasses seventeen counties in North Texas and eight counties in Oklahoma. The region includes two major drug market areas, the Dallas/Fort Worth metropolitan area and Oklahoma City metropolitan area. It also includes three primary satellite areas: Amarillo and Tyler, Texas and Tulsa, Oklahoma. These markets constitute the most significant areas of illicit drug trafficking and abuse within the HIDTA region.
[1] Governor Abbot Unveils Texas Fentanyl Data Dashboard, July 13, 2023, https://gov.texas.gov/news/post/governor-abbott-unveils-texas-fentanyl-data-dashboard
[2] Ahmad FB, Cisewski JA, Rossen LM, Sutton P. Provisional drug overdose death counts. National Center for Health Statistics. 2024.